Week 1 - Foundamentals review & Compositions of Returns
Foundamentals review
Capital Asset Pricing Model (CAPM)
Excess return of a stock is proportional to its beta

\( \beta \): covariance - systemtic risk - sensitivity to the market
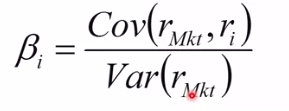
- \( \beta \) = 1, stock moves with the market exactly
- \( \beta \) > 1, stock amplifies market
- 0 < \( \beta \) < 1, goes with market, but less so, e.g. Walmart
Stadard deviation (\(\sigma\)): measure of total risk
CAPM: assets with higher \( \beta \) should have higher benchmarks. Can't sipmly compare returns of assets. Prices and expected returns should reflect how sensitive it is to overall market
Alpha (\(\alpha)\): performance of an asset relative to its CAPM predicte return.

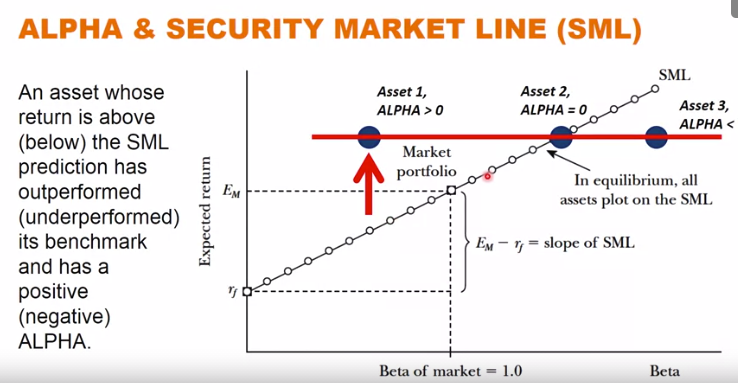
asset 1 less beta than market but still same return - better
3-Factor model
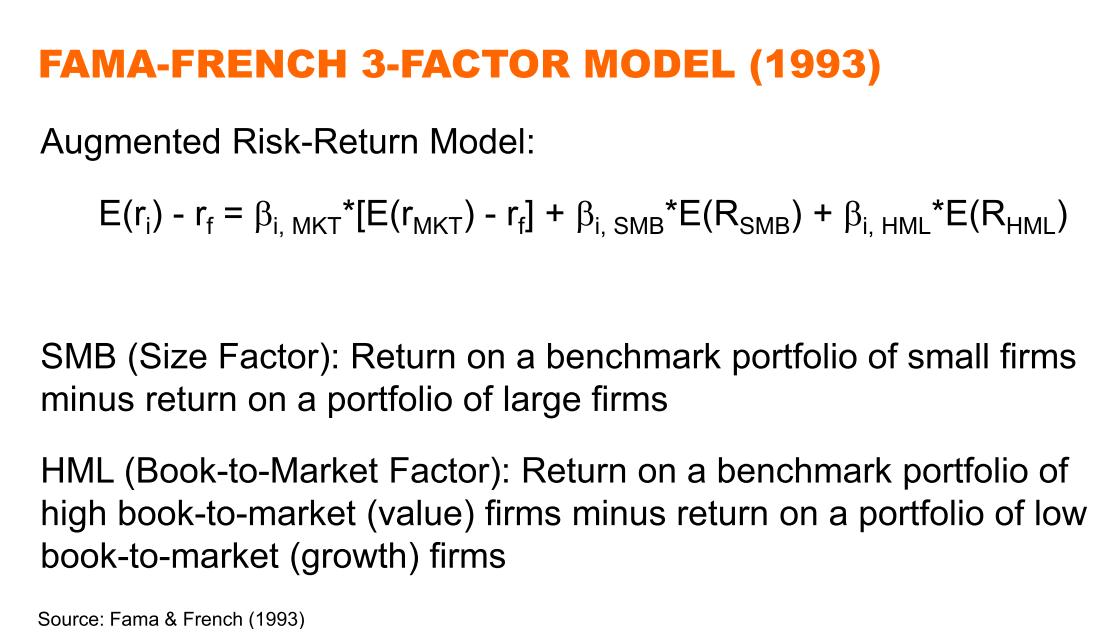
In reality, \( \beta \) generally does not predict returns as strongly as CAPM. Other factors that predict returns.
- firm size
- small firm outperform large
- famous value premium
- "value stock" have historically outperformed (vs. "growth stock")
- high book/market ratio - value stock
augmenting CAPM:
Market efficiency
Interpretation of market anomalies:
- risk
- irrational behavior
- data mining - coincidentally fit the pattern
Efficieint Market Hypothesis (EMH)
- Semi-strong form EMH: stock prices reflect all publically available information
Regression
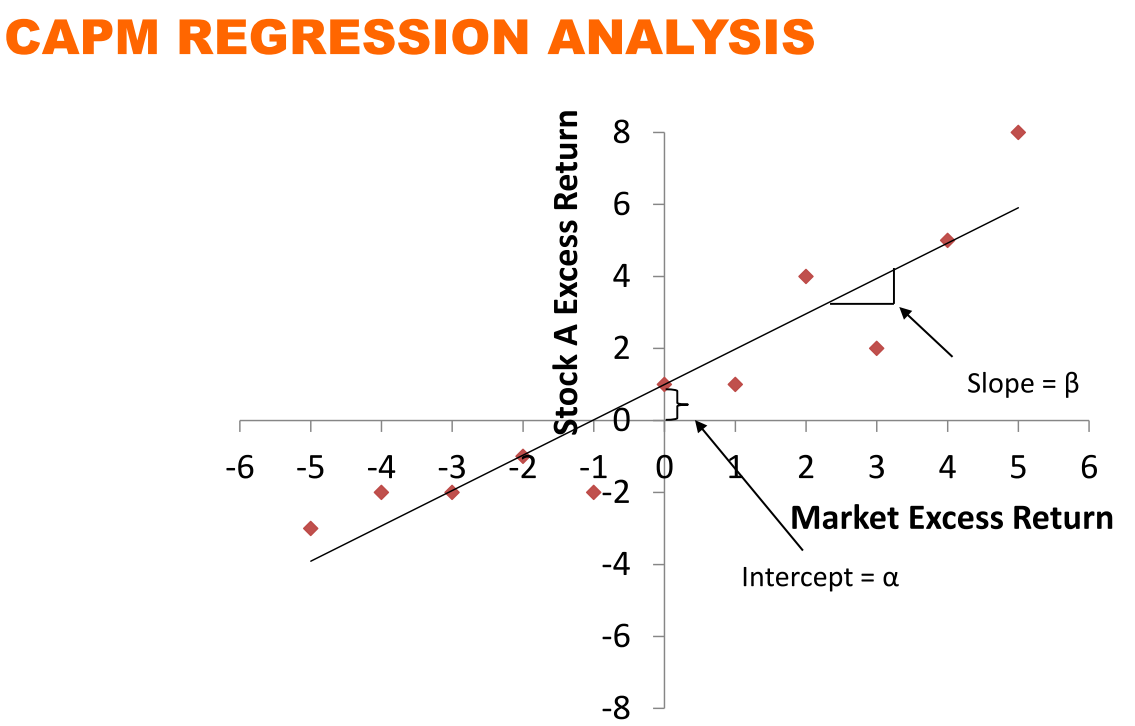
- p-value: prob. of finding the observed coefficient estimate under the null hypothesis
- common cutoff: 0.05 or smaller
- statistical significance: 5% means p value is less than 0.05
- t-statistic: ratio of coefficient to the standard error of the coefficient
- common cutoff: 2 or more
- (\(r^2)\)- goodness of fit. how much of variability of dependent variable is explained by independent variable ( 0= no relation 1= fit perfectly)
Compositions of Returns
-
Definition of return
\( Returnt = { ( Price_t - Price{t-1} + Dividendt ) \over Price{t-1} }\)
-
Dividend vs capital gain - theorically should be same, but practically taxed differently
Realization-based capital gains tax
- realize loss within a year. so deduction is valued at regular income tax
- realize before 12/31
- realize gain after a year
- postpose after 12/31 so tax is delayed for next year
- Tax delayed = tax saved
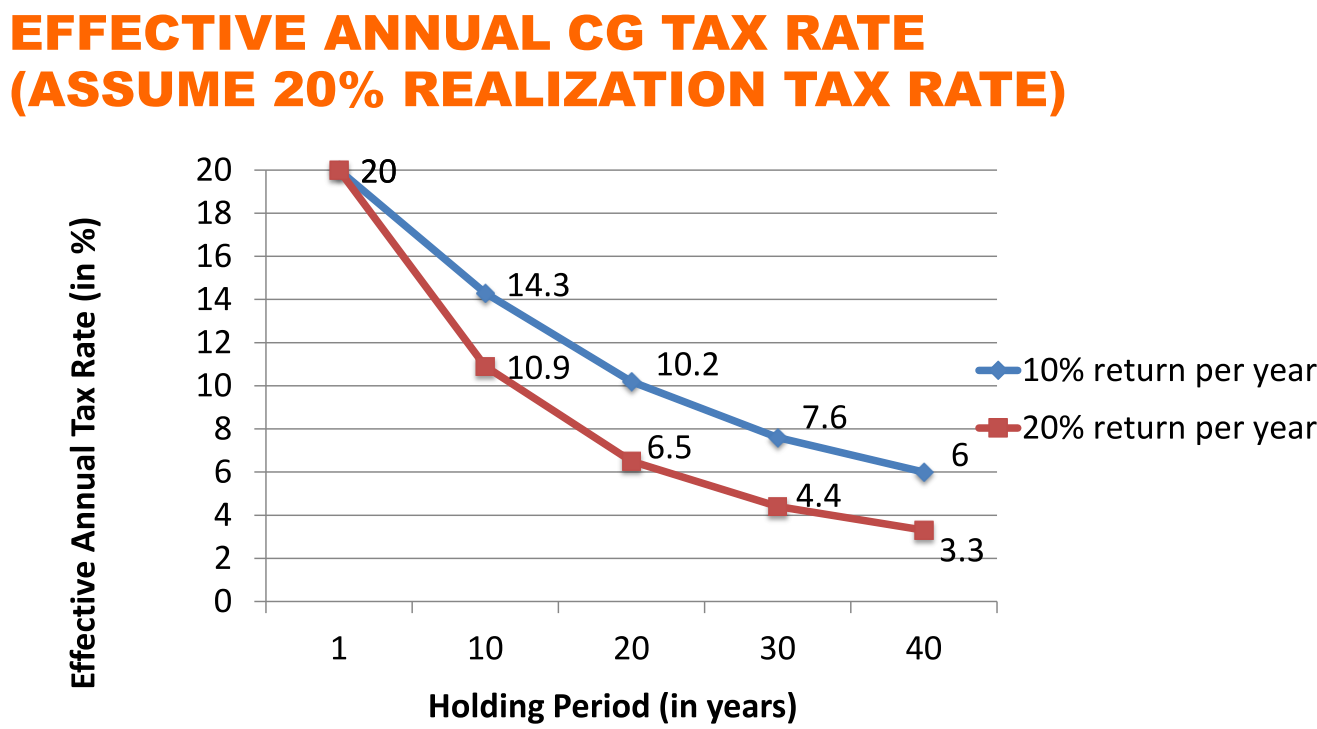
- example: if asset is 10% return, 20% cap gain tax, sell after 10 years -> equivalent annual tax rate = 14.3%
- basis step-up at death
- when someone dies, potential cap gain liability dies with them
Seasonality in stock returns
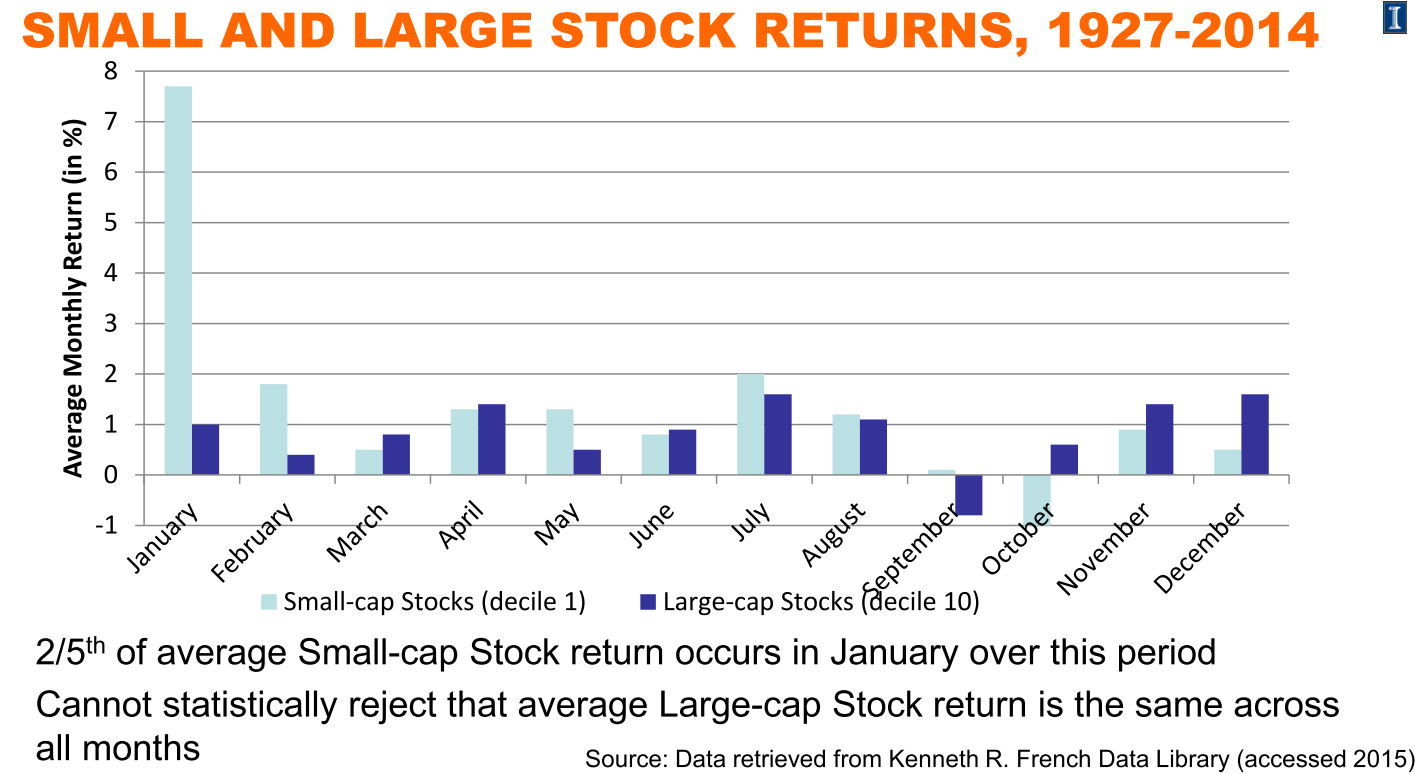
- "january effect" in return of small stocks
- hypothesis: strong incentive to sell at end of year
- window-dressing by institutions - sell losing stock at end of the year to avoid reporting holding losing stocks
- tax loss by individuals - tax deduction incentives
- effect is larger for stocks that have experienced lossees in hte prior year
- regression analysis against different tax rules over the years shows the effect tax loss by individuals have significant effect
- the effect declining over time
- may due to publicity
- assuming the effect persists:
- untaxed investors can buy in Dec
- hypothesis: strong incentive to sell at end of year